Number A-32 in Series, "New Federalism: Issues and Options for States"
The nonpartisan Urban Institute publishes studies, reports, and books on timely topics worthy of public consideration. The views expressed are those of the authors and should not be attributed to the Urban Institute, its trustees, or its funders.
This series is a product of Assessing the New Federalism, a multi-year project to monitor and assess the devolution of social programs from the federal to the state and local levels. Alan Weil is the project director. The project analyzes changes in income support, social services, and health programs and their effects. In collaboration with Child Trends, the project studies child and family well-being.
The project has received funding from The Annie E. Casey Foundation, the W.K. Kellogg Foundation, The Robert Wood Johnson Foundation, The Henry J. Kaiser Family Foundation, The Ford Foundation, The John D. and Catherine T. MacArthur Foundation, the Charles Stewart Mott Foundation, The David and Lucile Packard Foundation, The McKnight Foundation, The Commonwealth Fund, the Stuart Foundation, the Weingart Foundation, The Fund for New Jersey, The Lynde and Harry Bradley Foundation, the Joyce Foundation, and The Rockefeller Foundation.
This series is dedicated to the memory of Steven D. Gold, who was codirector of Assessing the New Federalism until his death in August 1996.
Note: Those wishing to print this report may find it easier to use the PDF Version.
In 1996, Congress passed the Personal Responsibility and
Work Opportunity Reconciliation Act (PRWORA), taking a major step toward moving
welfare recipients off the rolls and into the workforce. Even before PRWORA,
many states had been operating their welfare programs under federal waivers
that allowed them to experiment with new welfare systems and place increased
emphasis on work. Some of the policies put in place to increase work include
emphasis on job placement rather than training, requiring recipients to work
or participate in work activities, allowing recipients to keep more of their
earnings, and stronger sanctions for those who fail to meet work mandates. As
a result of these changes in welfare policy and stellar labor market conditions
in recent years, welfare caseloads have decreased substantially. From March
1994 (the peak for welfare caseloads) to September 1998, the national caseload
of Aid to Families with Dependent Children (AFDC; now called Temporary Assistance
for Needy Families—TANF) decreased by 43 percent. Many states’ caseloads fell
even more; for example, Wisconsin’s caseload decreased by 87 percent, South
Carolina’s by 61 percent, and Texas’s by 55 percent.1
Given welfare policies’ greater emphasis on leaving the
rolls for work, interest has grown in determining how families that have left
the program are faring. State and local governments, policymakers, and others
want to know whether those who leave welfare ("leavers") are financially better
off than when they were receiving benefits. The primary concern is whether leavers
have found jobs and, if so, whether their hourly wages or hours per week are
high enough to raise their families out of poverty. Policymakers and researchers
would also like to know to what extent leavers are relying on other forms of
federal, state, or local assistance.
Many localities have sought to answer these questions through
studies of leavers’ well-being. This brief summarizes findings on employment
rates, characteristics of employment, and other determinants of well-being from
11 such studies conducted in Indiana, Iowa, Maryland, Michigan, Ohio (Cuyahoga
County), South Carolina, Tennessee, Texas, Washington, and Wisconsin. We focus
on employment because of its key role in determining welfare leavers’ economic
well-being. Because of the great number and variety of "leaver studies" being
undertaken, we also point out issues to consider in comparing study results.
Numerous studies of welfare leavers have been published,
and more are being released all the time.2
We attempted to review all publicly available studies that examine employment
outcomes. Only studies that clearly described their methodology and reported
survey response rates of 50 percent or higher were included.3
While some studies that meet these criteria may have been missed, this brief
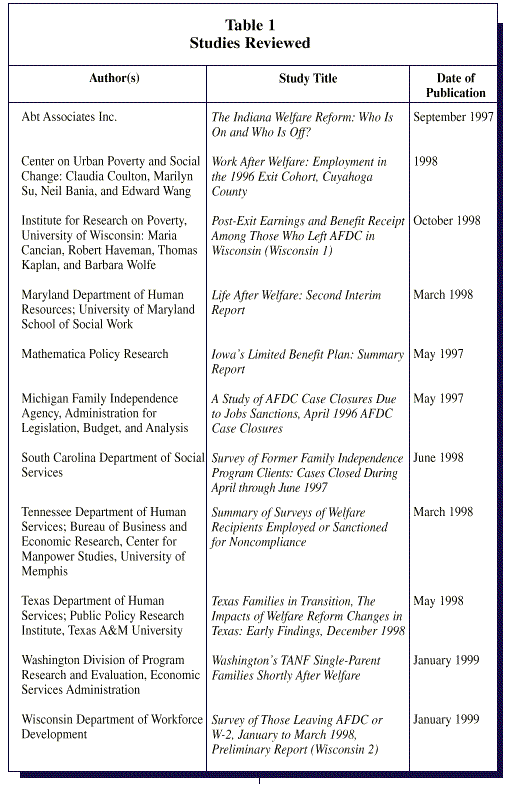
presents results from a range of reports. Table 1 gives
the titles and authors of the studies reviewed in this brief.4
Comparing Study Results
All the studies discussed deal with leavers’ well-being,
but there are many differences among them that need to be considered when examining
results. These studies are for different geographic areas, representing varying
labor market conditions, urban and rural conditions, and state and local policies.
The reader needs to keep all of these differences in mind when interpreting
results. The results from one area (or all of the areas discussed here taken
together) cannot be generalized to other geographic areas. Except for Texas,
neither the largest states in the United States nor the states with the highest
population of welfare recipients are represented in this review. Several geographic
areas are also not represented. Our intention here is to examine studies for
a number of different areas to provide a mosaic of results from around the country.
Study areas differ in the amount and type of welfare reform
that had taken place before the study was conducted. For example, Cuyahoga County,
Ohio (Cleveland area), obtained data before welfare reform in order to have
comparison statistics once reform had begun. Wisconsin, at the forefront of
welfare reform legislation, had a high degree of pre-PRWORA reform activity
and may reveal information on longer-term results of welfare reform. Michigan
and Texas conducted their studies specifically to determine what immediate effects
welfare reform had in their respective states. The Texas Works program diverts
applicants from receiving cash benefits by training them and helping them find
jobs. Coverage by work requirements and sanction policies also differs across
states.
Other differences in the studies are more subtle; differences
in methods used can make comparisons tricky. These include differences in how
the leaver population studied is defined (including the reason the person left
welfare, whether he or she has remained off welfare, and the length of time
since leaving welfare) and in how specific outcomes, such as employment, are
measured. The brief highlights these differences to show how important it is
for the reader to be vigilant in understanding exactly what is being presented.
For example, variations in measures used have led to employment rate differences
of as much as 20 percentage points for the same geographic area.
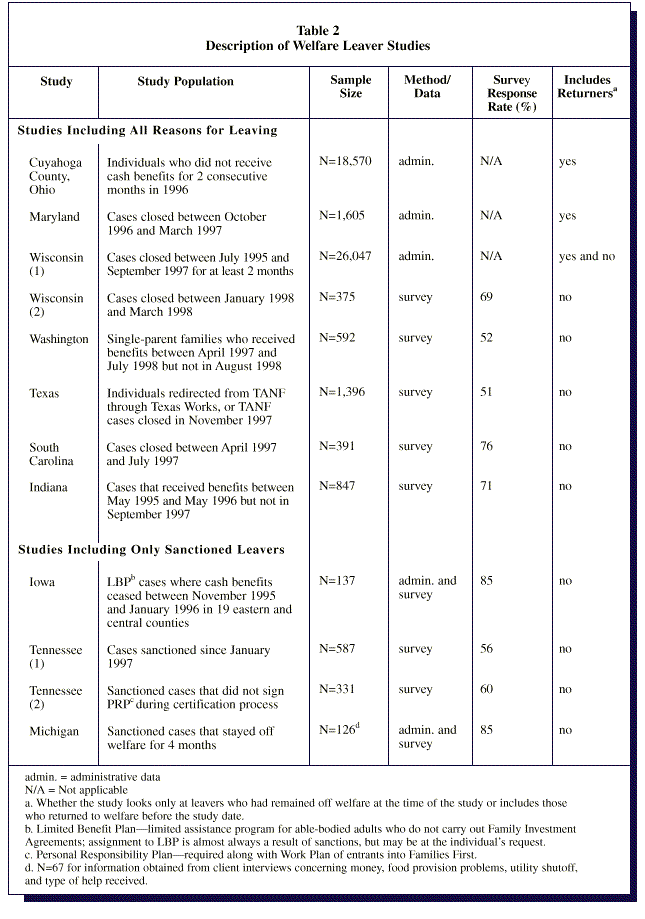
Table 2 shows differences across studies
in the population examined, sample size, type of data used (administrative or
survey), and response rates for surveys. The majority of the studies combine
in their leavers population those who left welfare "voluntarily" and those who
were cut off as a result of sanctions—that is, because they did not follow the
rules of the program. However, both of the Tennessee studies and the Michigan
study looked only at sanctioned families, and the Iowa study focused on participants
in Iowa’s Limited Benefit Program, where almost 80 percent of assignments are
the result of sanctions. Considering only sanctioned families excludes most
recipients who leave the rolls because they have found new or better jobs, which
likely results in lower estimates of employment rates. There may also be differences
in employability or personal drive for independence between people who leave
welfare because of sanctions and those who leave for other reasons. The sanction/nonsanction
distinction is noted in table 2.
The table also notes whether the group examined included
leavers who had returned to welfare by the time the data were collected. "Continuous"
leavers—those who remain off welfare until the time of the survey—are more likely
to be working than those who return to welfare. Therefore, studies combining
both ("Includes Returners" in table 2) will likely have
lower total rates of employment.
The length of time since leaving welfare also varies by
study, so different studies report information for different time frames. Cuyahoga
County and Wisconsin (1) report results for multiple quarters following exit,
but the majority of studies gathered information for either the first 6 months
or the 6 to 12 months following case closure. Indiana provides information about
leavers 16 to 28 months after leaving.
Employment
The rate of employment among leavers is an important indicator
of movement toward self-sufficiency and is a basic measure in considering leavers’
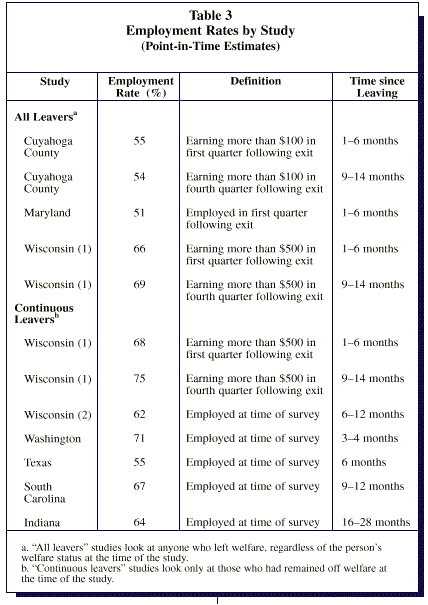
economic well-being. Table 3 presents "point-in-time" employment
rates: a measure of the percentage of people working at a specific time (often
the week before a survey). Excluding sanction-only studies, all studies report
employment rates over 50 percent, with the majority between 65 percent and 80
percent. Maryland reported the lowest rate at 51 percent and Wisconsin (1) the
highest at 81 percent (for continuous leavers in the fifth quarter after leaving
welfare). These rates are much higher than employment rates for people currently
receiving welfare benefits. The Administration for Children and Families reported
that 28 percent of current TANF recipients were employed during fiscal year
1997.5
As noted above, the methods used for calculating employment rates vary across
studies, so while employment is a straightforward concept, it is difficult to
make comparisons across studies.
In general, when all leavers were included in the study
population, regardless of reason for leaving, slightly lower employment rates
were found than when only the leavers who remained off welfare (continuous leavers)
were included. Cuyahoga County and Maryland reported similar employment rates
for the first quarter off welfare: 55 percent and 51 percent, respectively.
Wisconsin (1) found a higher percentage of leavers (66 percent) to be employed.
For continuous leavers, Wisconsin (1) found 68 percent employed in the first
quarter following exit, and Washington and South Carolina reported rates of
71 percent and 67 percent, respectively. Generally, samples that include people
who return to welfare show lower employment rates than do studies focusing only
on leavers who remain off welfare.
Additional differences in employment rates come from how
"employed" is defined in studies using administrative data and from the length
of time between leaving welfare and when employment is measured. In administrative
data, earnings information is generally available for a calendar quarter, and
studies use different earnings thresholds to determine who was employed. Some,
like Cuyahoga County, report anyone earning more than $100 in a quarter as employed
for that quarter; some, like Wisconsin (1), use a cutoff of $500; and others,
such as Maryland, count people as employed if they had any reported wages in
a quarter. The resulting differences can be large. For example, Wisconsin (1)
found that employment rates in the first quarter after exit varied from 72 percent
when counting any earnings as employed to 66 percent when a threshold of $500
of earnings in a quarter was used. This difference is larger than some of the
differences across areas, indicating that many leavers had relatively low levels
of earnings.
The reviewed studies measure employment at various times
after leaving welfare. These employment rates could vary for a number of reasons;
for example, more leavers may find work over time or more may lose jobs. In
samples that exclude those who return to welfare, employment rates will probably
increase simply because those least likely to work are no longer in the sample.
Over a longer period of time, the impact of including those who return will
be stronger since more people will have returned to welfare. Cuyahoga County
and Wisconsin (1) found little or no change in employment rates comparing the
first quarter with the fourth quarter after leaving. For continuous leavers,
there does not seem to be any clear pattern across studies with different time-since-left-welfare
measures.
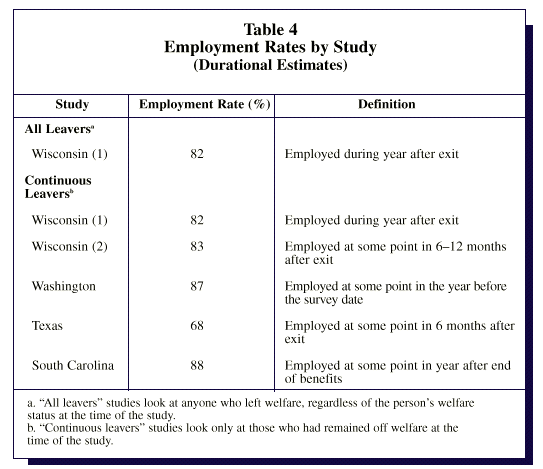
Another way of measuring employment rates is the percentage
of leavers who worked at any time during a given period. These are called "durational
estimates" and are expected to be higher than point-in-time estimates. As table
4 shows, most studies reported fairly high durational employment rates,
between 68 percent (Texas) and 88 percent (South Carolina). Four samples had
employment rates above 80 percent. Increases in employment rates when moving
from point-in-time to durational rates may be quite large; for example, there
was a 21 percentage point increase in Wisconsin (2). Texas’s employment rate
of 68 percent could be lower in part because it examines only the first six
months after leaving the welfare rolls, compared with the entire year following
exit.
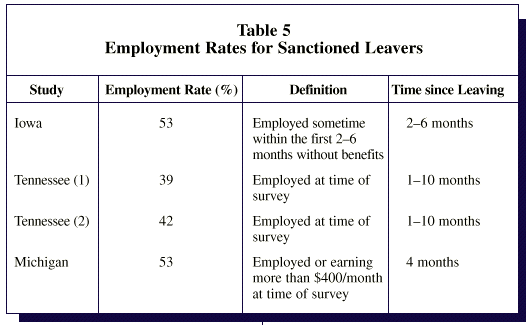
Employment rates for sanctioned leavers were generally lower
than those in samples that included all leavers regardless of reason (table
5). Tennessee (1) found an employment rate of 39 percent, while Tennessee
(2) reported a slightly higher rate of 42 percent. The employment rate for sanctioned
people in Michigan and Iowa was higher, at 53 percent, but still lower than
most of the employment rates reported for the combined sanctioned and nonsanctioned
study populations. The Iowa employment rate was measured over four months and
therefore may be somewhat higher than a point-in-time estimate.
Hours and Earnings
Employment rates alone do not completely describe the income
status of welfare leavers. Other factors—such as hours worked, wages, income,
and occupation/industry—play an important role in determining leavers’ earnings
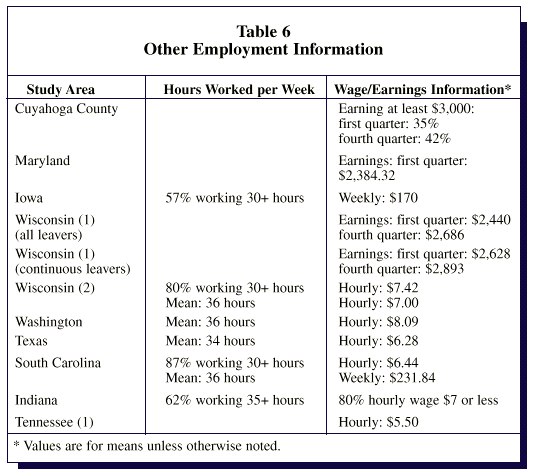
(table 6). According to the studies that reported hours
worked per week, over half of employed leavers work 30 or more hours, nearly
full-time. Iowa found 57 percent and South Carolina 87 percent of leavers to
be working 30 or more hours. Indiana reported 62 percent of leavers working
35-plus hours. The mean number of hours worked in Wisconsin (2), Washington,6
and South Carolina was 36. Texas reported similar findings of 34 hours per week.
In general, these studies indicate that leavers are not
earning enough to raise their income far above the poverty level. In 1997, the
poverty threshold for a three-person family with two dependent children was
$12,931, the equivalent of full-time (35 hours per week), full-year (50 weeks
a year) work at $7.39 an hour. If one adult works an average of 34 hours per
week for 50 weeks at an hourly wage of $5.15 (minimum wage since October 1997),
the family’s yearly earnings would be only $8,755. Of course, this considers
only earnings; additional sources of income, including the Earned Income Tax
Credit (EITC) and child support, will increase family income. Noncash benefits
such as food stamps and Medicaid are also important sources of support. On the
other hand, working entails expenses that may not be incurred while on welfare,
most notably child care costs.
Cuyahoga County reported that only 35 percent of leavers
were earning $3,000 or more in the first quarter after exit. Wisconsin (1) and
Maryland reported the mean earnings of leavers during the first quarter after
exit to be approximately $2,500. Assuming quarterly earnings remained unchanged
over the course of a year, the average family in the two studies had earnings
of $10,000 to $12,000, less than the poverty level for a family of three. These
calculations likely overestimate leavers’ true yearly earnings, because many
leavers do not work full-time for the entire year. For example, Washington reported
that leavers worked an average of 34 weeks in the past 12 months.
Wisconsin (1) calculated how actual earnings after leaving
welfare compared with the poverty level, taking into account the number of children.
The study found that for leavers who did not return to welfare, a little more
than a third to about half of leavers’ earnings were above the poverty level,
depending on the number of children.
Reports of average weekly earnings and hourly wages give
similar results. Leavers in Iowa and South Carolina had average weekly earnings
of $170 and $232, respectively. Even at a full year of work, these earnings
($8,500 to $11,600) fall below poverty for a family of three. South Carolina
reported average hourly wages of $6.44. Wisconsin (2) and Texas reported $7.42
and $6.28, respectively. Indiana found that 80 percent of leavers earned $7
an hour or less. Washington reported the highest average hourly wages of these
studies, at $8.09.
These findings on earnings must be put in the context of
total income support after leaving welfare and the expenses involved with work.
Future studies that follow the same cohort of leavers will tell us if these
families’ earnings increase as they gain work experience and skills.
Another measure of how leaver families are faring is whether
their postwelfare income is higher than their income while receiving benefits.
Only one of these studies, Wisconsin (1), explicitly calculates this figure.
Four other studies ask welfare leavers whether they have more income since leaving
welfare (not shown). Of these, only South Carolina found that a majority (66
percent) of leavers had more money after leaving welfare. Wisconsin (2) and
Iowa found that close to half of leavers say they have less income after exit—40
percent and 47 percent, respectively. South Carolina’s higher percentage is
probably connected to the fact that the state’s benefits are lower than those
of the other states. Wisconsin (1) compared a family’s earnings after leaving
with earnings plus AFDC before leaving and found that most leaver families had
lower post-exit earnings than pre-exit earnings and cash benefits. Among families
with one child, 49 percent of leavers had greater cash incomes after they left
welfare. As family size grows, current economic status compares less favorably
with pre-exit status. For families with three or more dependent children, only
38 percent of leavers had greater cash income after leaving.
Type of Work
A subset of studies also report on the types of jobs leavers
hold. While studies use different occupation and industry groupings, making
direct comparison of specific job types difficult, a general pattern does emerge.
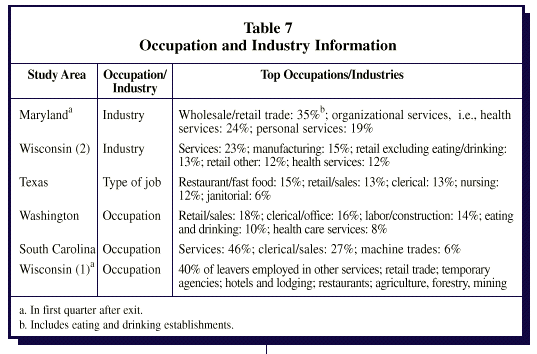
Leavers’ jobs generally seem to be concentrated in low-wage industries and occupations
(table 7).
Maryland and Wisconsin (2) found that the two industries
that employed the most leavers were wholesale/retail trade, including eating
and drinking establishments, and services, respectively. Texas found 41 percent
of leavers employed in restaurant/fast food, clerical, or retail/sales jobs.
Sales and services were the most commonly reported occupations for leavers in
the Washington and South Carolina studies, respectively. Wisconsin (1) found,
in the first quarter after leaving welfare, 40 percent of leavers employed in
the industries with the lowest median earnings for that quarter.
Other Sources of Support
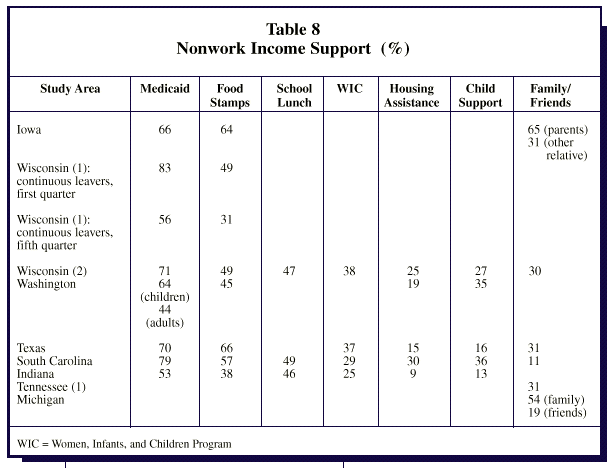
Use of other government programs is one indicator of leavers’
self-reliance and continued need for safety net assistance. Table
8 presents information concerning non-TANF receipt of government assistance
by leavers who have not returned to welfare. Since Medicaid and food stamps
receipt are virtually universal among TANF recipients, including those who return
would inflate rates of receipt.
Studies report that over half of leavers’ families are still
covered by Medicaid. In the first year after leaving welfare, studies report
Medicaid coverage between 66 percent (Iowa) and 83 percent (Wisconsin (1)).
Medicaid coverage rates are expected to fall following the first year after
exit in states where transitional Medicaid benefits are offered to leavers for
the first 12 months following exit.7
In Wisconsin (1), coverage had dropped by a third to 56 percent by the fifth
quarter after leaving Medicaid. Indiana reported that 16 to 28 months after
leaving welfare, 53 percent of leavers continued to be covered by Medicaid,
a substantially lower coverage rate than that of other areas in the first year
after exit.
Some leavers also continue to receive food stamps, although
reported rates are typically not as high as for Medicaid. Food stamp receipt
ranges from a low of 38 percent in Indiana to a high of 66 percent in Texas.
As with Medicaid, rates were higher in the first year after leaving. In the
first year after exit, food stamp receipt is between 45 percent and 66 percent.
Wisconsin (1) found leavers to have lower receipt in the fifth quarter, falling
from 49 percent to 31 percent. Indiana reported that one to two and a half years
after leaving, 38 percent of leavers were receiving food stamps. It is not clear
what this decline means, because there is no change in benefit rules after a
year of receiving food stamps, unlike the rule changes in transitional Medicaid.
It could mean that families are doing well and no longer need benefits or that
families have lost connection with benefits offices or no longer think they
are eligible.
Leavers also may rely on various nongovernment sources of
income support. The Iowa study suggested that leavers turn toward family and
friends and other lessstructured methods of help in the early months without
benefits, and return to government programs after being off welfare for a longer
period. The results for declining use of Medicaid and food stamps do not support
this theory generally. However, Iowa finds a higher percentage than other studies
do of leavers in the first six months after exit relying on family or friends.
Iowa found that 65 percent of leavers turned toward their parents and 31 percent
to other relatives for emotional, financial, and child care support. Wisconsin
(2), Texas, and Tennessee all found that around 30 percent of leavers are relying
on family for at least some support. South Carolina reported only 11 percent
of leavers to be relying on family or friends. All of these studies are for
periods six months or more after exiting.
Child support receipt varied across studies. In Texas, 16
percent of leavers were receiving child support; in Wisconsin (2), South Carolina,
and Washington, between 27 percent and 35 percent of leavers were receiving
this income.
A few studies report receipt of other forms of government
assistance, such as school lunch; the Women, Infants, and Children (WIC) supplemental
food program; or housing assistance. Each of these programs has its own eligibility
criteria, and not all former welfare recipients are eligible. Also, benefits
such as rental assistance are not entitlements, so some eligible families may
not have access to this source of support.8
Across the board, a minority of leavers receive these benefits. In Wisconsin
(2), South Carolina, and Indiana, slightly less than half of leaver families
report receiving benefits from the school lunch program. These areas and Texas
report that around a third of leavers receive WIC. Even fewer studies report
receipt of housing assistance. Wisconsin (2) and South Carolina combine rental
assistance and public housing into the same category and report rates of receipt
at 25 percent and 30 percent, respectively. The rates in Washington, Texas,
and Indiana are less than a fifth.9
Further research on leavers’ eligibility for these programs and the extent of
participation among eligible persons is necessary to understand why so many
families did not receive these benefits.
Indicators of Well-Being
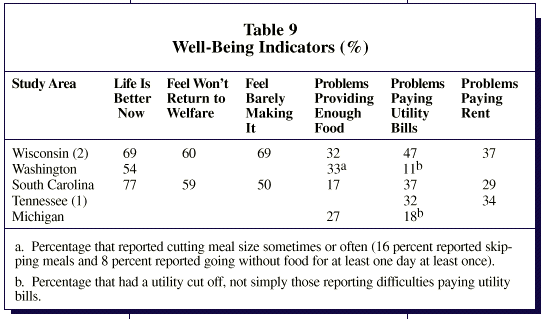
Several studies report additional indicators of leavers’
well-being (table 9). These are all direct questions to
families about their perceptions of their current situation and whether they
have experienced specific economic struggles. A mixed picture emerges from their
responses. As explained earlier, many families believe that they have less income
than before leaving welfare. However, most families do not report having trouble
providing food or paying bills. In Wisconsin (2) and South Carolina, which asked
about an extensive list of attitudinal indicators, two-thirds or more say life
is better now, and one-half to two-thirds say they are barely making it.
South Carolina and Wisconsin (2) also asked leavers how
they felt their current situation compared with their pre-exit situation (table
9). Most leavers claim to be better off now than they were when they received
cash benefits. However, both studies reported that at least 70 percent of leavers
still worry about having enough money and over half claim to be "just barely
getting by." At the same time, South Carolina, Wisconsin (2), and Washington
found that over 50 percent of leavers felt "pretty sure" they would not need
to return to welfare and/or think that life is better now.
Some of the surveys included questions directly related
to the frequency of certain hardships (table 9). The majority
of leavers do not report hardship, but a significant minority do. Approximately
a third of leavers in Michigan, Wisconsin (2), and Washington reported that
they had some problem providing enough food for the family; in South Carolina,
17 percent of leavers experienced this problem. Both Wisconsin (2) and South
Carolina found that a larger percentage of leavers reported not having enough
money for food after they left welfare than when they were receiving benefits.
Three of five studies—Wisconsin (2), South Carolina, and Tennessee (1)—found
that about a third or more of leavers had problems paying rent or utility bills.
Smaller numbers of leavers in Washington and Michigan experienced these problems.
Conclusion
The studies reviewed here cover various geographic areas,
labor market conditions, and welfare reform policies. They should not be generalized
to the nation as a whole, as they represent only a subset of states. However,
some general patterns emerge. A majority of welfare leavers are working. Studies
that include people who left welfare for any reason, including sanction, found
that shortly after leaving welfare, half to two-thirds (between 53 percent and
70 percent) of welfare leavers were employed at a point in time. Leavers who
remain off welfare tend to have higher employment rates than those who return
to welfare. Those who left as a result of sanctions have lower employment rates.
An even greater percentage of leavers had been employed at some point since
leaving. Durational employment rates over a period of six months to a year were
between 70 percent and 80 percent. Most employed leavers are working a substantial
number of hours per week, more than part-time. Studies that reported information
on hours worked per week showed that half of those employed were working at
least 30 hours per week on average.
Information on wages, earnings, and type of job reveals
that leavers usually have low-wage jobs, so their earnings remain low despite
high employment rates and number of hours worked. The earnings information gathered
from these studies shows that the average leaver’s earnings are below the poverty
level, and most leavers report having incomes that are lower than or similar
to their combined earnings and benefits before exit. These studies do not often
take into account other sources of income, such as child support or the EITC,
which can make significant differences in net incomes. They also do not consider
additional work expenses, including child care and transportation costs.
Many leavers continue to use Medicaid, food stamps, and
other government programs. One-half to two-thirds of leavers continue to receive
Medicaid, while about half receive food stamps. We need more information to
understand why participation in these programs is much lower than the near-universal
participation of persons on welfare, including the degree to which families
are no longer eligible, are not aware of eligibility, or feel they no longer
need these benefits.
Reports of economic struggles and perceptions of economic
well-being are mixed. Despite low-wage jobs and continued use of other forms
of income support, a few studies found that most families believe they are better
off exiting and are confident they will not need to return to welfare. At the
same time, around a third of families report problems providing enough food,
paying utility bills, and paying rent. A few studies find significant reliance
on family and friends as a means of additional support.
The patterns exhibited in these studies, although preliminary
and supporting only tentative conclusions, provide some information on the status
of welfare leavers and some questions for further study. While many leavers
are working, the total picture of their economic status is unclear. We lack
good estimates of leavers’ total income. We do not yet understand whether low
rates of participation in government programs reflect higher incomes (lack of
eligibility), desire to be independent of government support, or difficulty
in gaining access to benefits. We also need to know more about these families
over time. Do they keep their jobs and have relatively steady incomes? Do they
progress in the labor market, moving into higher-paying jobs? What is the impact
on families’ well-being when they are no longer able to return to welfare because
of time limits?
In addition, interpretation of these results would benefit
from comparison group results that would allow us to put results in context.
Are these employment rates high or low when compared with rates for similarly
situated families that have not received welfare? Are former welfare recipients
different from other "working poor" families? In what ways? Such comparisons
could help to inform policy directions, including whether to focus on policies
for former recipients or policies for a broader group of low-income families.10
Finally, future studies can make increased efforts to connect
findings to the specific policy environment in a state or locality. The large
differences in policies and point of implementation in the areas conducting
these studies provide an opportunity to look across states to learn how different
approaches to welfare reform relate to the economic status of leavers. Continuing
study is needed to truly understand the effects of welfare reform changes on
these families.
Notes
1. Administration for Children and Families,
Office of Family Assistance, Department of Health and Human Services.
2. Several studies that also attempt
to review information on welfare leavers have recently been released: Welfare
Recipients Who Find Jobs: What Do We Know about Their Employment and Earnings?
Sharon Parrott, Center on Budget and Policy Priorities; and Work, Earnings,
and Well-Being after Welfare: What Do We Know? Maria Cancian, Robert Haveman,
Thomas Kaplan, Daniel Meyer, and Barbara Wolfe, Institute for Research on Poverty,
University of Wisconsin, Madison.
3. A response rate of less than 50 percent
means that more than half the people intended to be surveyed were not located
or refused to answer. This high level of nonresponse could mean the reported
answers are quite far off from what the actual answers would be if everyone
had been contacted. For example, if working people are less likely to answer
the survey, reported employment rates would be too low. It is not clear which
direction bias might take. A 50 percent response rate threshold is actually
quite low, but it was chosen because of the large number of studies with low
response rates. Studies in Kentucky, New Mexico, and New York City were excluded
because of low response rates. Rates for included studies are reported in table
2.
4. Because two separate studies for
Wisconsin are included in this review, we refer to them as Wisconsin (1) and
Wisconsin (2). The South Carolina Department of Social Services has conducted
several additional leaver studies focusing on separate cohorts of leavers that
are not included here. The Tennessee report in this review is a summary and
update of several separate studies that use different samples. Two of those
studies are discussed here as Tennessee (1) and Tennessee (2).
5. ACF web site, http://reddog.acf.dhhs.gov/programs/opre/particip/prrate97.htm.
6. Information on employment characteristics
in Wisconsin (2) is for leavers’ "best job." The Washington study reports employment
characteristics for those who are currently working or worked sometime during
the past 12 months. This includes people who worked while on welfare, but not
once they left.
7. A number of states have extended
transitional Medicaid benefits beyond 12 months.
8. Another consideration is that these
data are reported by leavers in surveys, not collected from program administrative
data. Benefit receipt in surveys is commonly found to be underreported.
9. Washington, Texas, and Indiana report
receipt of housing assistance, public housing, and rental assistance, respectively.
10. For a nationally representative study
of former welfare recipients using data from the National Survey of America’s
Families and comparing the results with data on other working poor families,
see Assessing the New Federalism discussion paper, "Families Who Left Welfare:
Who Are They and How Are They Doing?" The Urban Institute, forthcoming.
About
the Authors
Sarah Brauner is a research assistant in the
Urban Institute’s Income and Benefits Policy Center. Her research interests
include welfare reform, government transfers, and poverty. She is presently
involved in research on current and former AFDC/TANF recipients and former food
stamp recipients.
Pamela Loprest is a senior research associate
in the Income and Benefits Policy Center. Her research focuses on barriers and
supports for work among low-income families and persons with disabilities. Her
recent work examines welfare reform and work policies and families recently
leaving welfare.
Tables
