The nonpartisan Urban Institute publishes studies, reports, and books on timely topics worthy of public consideration. The views expressed are those of the authors and should not be attributed to the Urban Institute, its trustees, or its funders.
Copyright © April 2001. The Urban Institute. All rights reserved. Except for short quotes, no part of this book may be reproduced in any form or utilized in any form or by any means, electronic or mechanical, including photocopying, recording, or by information storage or retrieval system, without written permission from The Urban Institute.
About the Series
Assessing the New Federalism is a multiyear Urban Institute project designed to analyze the devolution of responsibility for social programs from the federal government to the states, focusing primarily on health care, income security, employment and training programs, and social services. Researchers monitor program changes and fiscal developments. In collaboration with Child Trends, the project studies changes in family well-being. The project aims to provide timely, nonpartisan information to inform public debate and to help state
and local decisionmakers carry out their new responsibilities more effectively.
Key components of the project include a household survey, studies of policies in 13 states, and a database with information on all states and the District of Columbia, available at the Urban Institute’s Web site (http://www.urban.org). This paper is one in a series of occasional papers analyzing information from these and other sources.
Contents
Executive Summary
This paper provides the most comprehensive examination ever made of trends in federal spending, including tax subsidies, on children. The summary below assesses changes in real spending (in 1997 dollars) between 1960 and 1997. Some 66 federal programs are classified within eight major budget categories: tax credits and exemptions (including the Earned Income Tax Credit and the dependent exemption), income security (including Aid to Families with Dependent Children), nutrition (including Food Stamps), health (including Medicaid), education, housing, social services, and training.1 Children are defined as individuals 18 years of age or younger.
- Federal spending on children grew 246 percent, from $48.6 billion to $168.5 billion while the number of children increased just 9.7 percent, from 67.1 million to 73.6 million. In terms of gross domestic product (GDP), however, this growth in children’s spending is just 11 percent, from 1.9 percent of GDP to 2.1 percent.
- Federal spending on low-income children increased 23-fold from $5.1 billion to $117.3 billion. Meanwhile, of all federal spending on children, the share spent on low-income children rose from 11 percent to 69 percent.
- Until very recently, programs that put money into parents’ pockets—such as tax credits, exemptions, and welfare cash payments—lost ground to targeted, in-kind spending—such as Food Stamps, housing, and Medicaid.
- The dependent exemption, a major feature of the "children’s budget," declined from 65 percent of all federal spending on children to just 16 percent, between 1960 and 1997.
- Three new programs account for half of the increase in total spending on children: the Earned Income Tax Credit, Medicaid, and Food Stamps. These are now the three largest programs, together representing one-third of federal spending on children.
- Nutrition and health programs now rank third and fourth among categories of spending on children, their levels increasing seven-fold over the period. However, education programs, which ranked third in 1960, now rank fifth.
- Federal education funds shifted from programs targeted at children of military or government personnel more toward children identified as economically, physically, or mentally disadvantaged.
- Spending on children increasingly shifted from broad-based middle class relief to programs aimed more at the poor, but with the consequent high marginal tax rates on earnings and marriage that come along with means-tested programs.
In the near future, federal spending on children will increase as a result of the 1997 child tax credit and the 1998 State Children’s Health Insurance Program. Over the longer term, however, spending on children will be under pressure as other programs with more rapid built-in growth absorb increasing shares of government revenues. For this reason, a key to the size and shape of the children’s budget is how policy makers balance the opposing forces of automatic growth in some current programs against a needs-based assessment of budget priorities.
Introduction
Since 1960, the federal government’s programs and functions have grown dramatically broader and bigger. Children have been the target of some of these changes, especially the expansions in tax credits, health care, and other forms of social assistance. But concerns over children and programs for children will not go away. Chief among these concerns are a poverty rate among children that is now the highest among all age groups, violence in schools and neighborhoods, and educational gaps.
Most of the information given on federal spending on children focuses narrowly on a single program or small groups of programs. To assess past trends more generally, as well as to make relative judgments about how public funds might be allocated in the future, it is often wiser to ask how all these programs fit together. A start—and admittedly it is only a start—is to try to gauge how spending on children has changed over the past few decades. How has growth in spending for children fared relative to other domestic spending or growth in the economy? Have programs to help children mostly devolved to the states? Which children’s programs have grown and which have shrunk in relative importance? Are direct expenditures favored, or are tax programs? And how is spending allocated among programs targeted at the poor and more universal programs?
Surprisingly, until now no comprehensive estimates of federal expenditures on children have been made. This study builds on earlier Urban Institute research to close that gap. (Some estimates were provided by Jason Juffras and Eugene Steuerle to the National Commission on Children in 1991, and more detailed data were compiled in "Federal Expenditures on Children, 1960–1995" (1995) by Rebecca Clark and Rosalind Berkowitz, an unpublished report to the Assistant Secretary for Planning and Evaluation, Department of Health and Human Services.) The current effort combines and significantly expands upon the earlier work by examining more programs in both the direct expenditure budget and the budget of tax subsidies and expenditures.
This analysis of recent trends in federal spending on children does not attempt to assess the success, failure, or merit of any particular type of spending. Nor do we want to even hint that the sheer quantity of money spent determines a program’s effectiveness. Nonetheless, this study does indicate the relative spending priorities of the federal government and of its elected officials. Moreover, it distinguishes between anecdotal impressions of growth in spending on children and real growth that takes into account inflation and overall economic growth. Such budget analysis also shows how the nation sets priorities within what might be thought of as a children’s budget. Finally, this view of the historic landscape allows readers of all political persuasions to assess possible directions for the future.
Overview of Methodology
The period covered is 1960 to 1997, with estimates provided for every fifth year plus 1996 and 1997. We analyzed 66 programs through which the federal government provides expenditures for children and classified these programs within eight major budget categories: tax credits and exemptions (including the Earned Income Tax Credit and the dependent exemption), income security (including Aid to Families with Dependent Children or AFDC), nutrition (including Food Stamps), health (including Medicaid), education, social services, housing, and training. (The individual programs in each of the eight categories are shown in table 1.)
| Table 1 Program Areas for Children Analyzed in the Eight Budget Categories |
| Tax credits and exemptions |
Earned Income Tax Credit (EITC), Dependent Care Credit, Credit for child medical insurance premiums, Dependent Exemption. |
| Income Security |
Social Security (young survivors and disability benefits), Aid to Families with Dependent Children (AFDC), Child Support Enforcement, Emergency Assistance, Supplemental Security Income (SSI), Railroad Retirement, Veterans* Benefits, Black Lung Disability. |
| Nutrition |
Food Stamp Program, Child Nutrition, Special Milk, Special Supplemental Food for Women, Infants and Children (WIC), Commodity Supplemental Food. |
| Health |
Medicaid, Children, Disabled children, Pregnancy and delivery, Maternal and Child Health (Block Grant), Immunization, Fluoridation, National Institute of Child Health and Human Development (NICHHD), Sudden Infant Death Syndrome, Healthy Start, Emergency Medical Services for Children, Adolescent Family Life. |
| Education |
Educationally deprived/economic opportunity, Supporting services, Dependents' schools abroad, Public lands revenue for schools, Assistance in special areas, Other, Impact Aid, Vocational (and Adult) Education, Grants for the disadvantaged, School Improvement, Indian Education, Bilingual and Immigrant Education, Education for the Handicapped, Emergency Social Assistance (Civil Rights). |
| Social Services |
Social Services (Block Grant), Community Services Block Grant, Children and Family Services Programs, Head Start, Child welfare services, Child welfare training, Child welfare research, Violent Crime Reduction Programs, Foster Care, Adoption Assistance, Independent Living, Child Care and Development Block Grant, AFDC Child Care, Transitional Child Care, At-Risk Child Care, Juvenile Justice, Family Preservation and Support. |
| Housing |
Low Income Home Energy Assistance, Low-Rent Public Housing, Section 8 Low-Income Housing Assistance, Rent Supplement, Rental Housing Assistance. |
| Training |
Job training partnership act (JTPA/Comprehensive employment and training act (CETA), Job Corps, Summer Youth Employment, JOBS/WIN, Participants who are minors; Job Corps; and summer youth employment. |
| * Refugee assistance was omitted from income security because estimates of the amount expended on children were only available for 1990 ($29.8 million) and 1995 ($22.3 million). |
In general, this study covers only expenditures directly benefiting children. The research techniques varied, depending on the characteristics of the federal program and the data that were available. Because money and other benefits are usually fungible, moreover, we cannot be sure that the funds or even in-kind benefits meant for children are actually consumed by them rather than by others in the household (the same is true for spending on adults). Nonetheless, while different decision rules for allocating dollars would produce somewhat different expenditure estimates for a given year, the overall trends in federal expenditures for children usually are not affected. Applying consistent methodology for all years allows appraisal of general trends. Generally, the rules allocating expenditures to children specify that money directly spent on them (e.g., school lunch, dependent exemptions) is counted in the total, while money parceled out according to family size (e.g., Food Stamps) is allocated to all family members according to formulas. (The methods are explained more fully in the appendix.)
Most data used here are from the Budget of the United States Government. We also relied heavily on information from the U.S. House of Representatives’ Overview of Entitlement Programs, commonly called the "Green Book." When neither could supply the data, we used information from federal agencies. The definition of "children" includes all individuals age 18 or younger; fortunately, in most cases, programs used the same definition.2
Overall Trends3
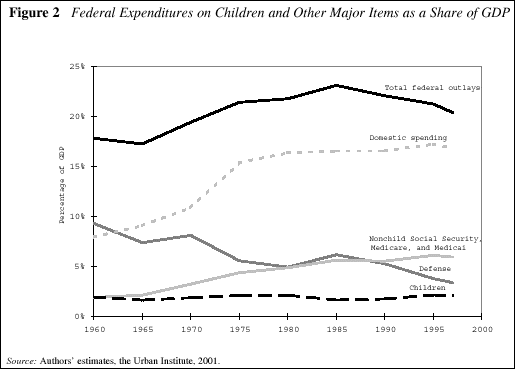
Between 1960 and 1997, the federal government increased its real spending on children by 246 percent, from $48.6 billion to $168.5 billion in 1997 dollars (figure 1). (Unless otherwise stated, all expenditures are given in real 1997 dollars, calculated using an inflation index called the GDP deflator.) The growth rate in federal expenditures on children lagged only slightly behind that of the total federal budget, which rose by 261 percent, from $443.8 billion to $1,601.2 billion. More generally, growth in federal expenditures on children closely parallels the expansion of the U.S. economy.4 Measured as a percentage of GDP, federal expenditures on children grew from 1.9 percent in 1960 to 2.1 percent in 1997 (figure 2).
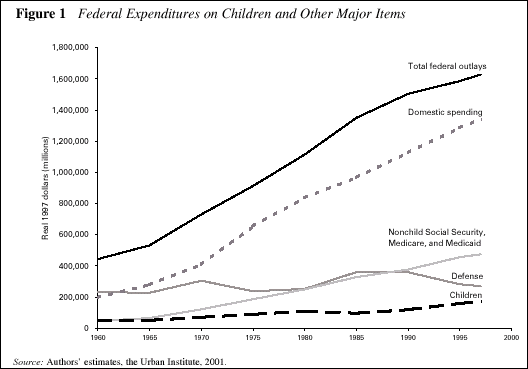
Over this period, domestic programs as a whole (all government expenditures other than defense and international affairs) grew from 7.9 percent to 16.8 percent of GDP. But children did not share much in this transfer to the domestic side of the budget. Indeed, the proportion of GDP spending allocated to them changed little. Instead, expenditures on Medicaid, Medicare, and Social Security (minus expenditures for children through Medicaid and Social Security) seem to have been the primary beneficiaries, rising from about 2 percent to almost 8 percent of GDP.5 Meanwhile, the percentage of GDP spent on defense declined from 9.3 percent to 3.4 percent.
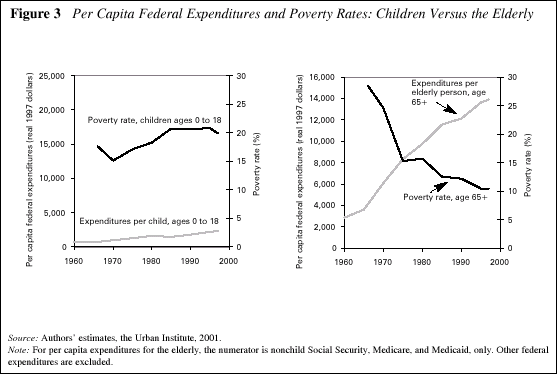
Per capita federal expenditures on children have increased in real dollars from $725 per individual age 0 to 18 in 1960 to about $2,290 in 1997 (figure 3). Despite periodic declines in child poverty—in the late 1960s, between 1983 and 1988, and since 1994—the poverty rate for children still increased from 17.6 percent to 19.9 percent over the entire period between 1966 (the first year official poverty rates were calculated) and 1997. In contrast, the poverty rate for the elderly over this period dropped from 28.5 percent to 10.5 percent.
From 1960 until very recently, there was a significant shift away from programs that leave spending on children to the discretion of their parents. In other words, less money was put into parents’ pockets and more was targeted to goods and in-kind services. Tax credits, exemptions, and welfare cash payments shrank, while such benefits as food stamps, public or subsidized housing, and Medicaid grew.
Despite recent shifts of responsibilities for public programs to the states, the states determine only a modest proportion of federal expenditures on children. That has been true historically and it remains true today, because tax credits and exemptions make up the bulk of federal expenditures on children. Other programs, such as Food Stamps and Supplemental Security Income, are federally financed but administered by states, which affects the numbers who apply. For two notable programs, spending levels are determined partially by states: Temporary Assistance for Needy Families (TANF, formerly Aid to Families with Dependent Children [AFDC]) and Medicaid. Under Medicaid, and under AFDC before it was reformed into TANF, federal spending was determined by a matching rate formula.
Major Channels of Federal Spending on Children
Major program areas are divided into eight categories: tax credits and exemptions, income security, nutrition, health, education, social services, housing, and training. In each, spending in real dollar terms increased over the period examined. As a share of GDP, however, the picture differs (figure 4). Expenditures in the two dominant children’s program areas in 1960—tax credits and exemptions and income security—both declined as a share of GDP by 1997, while all other children’s programs expanded as a share of GDP, especially expenditures on health and nutrition.
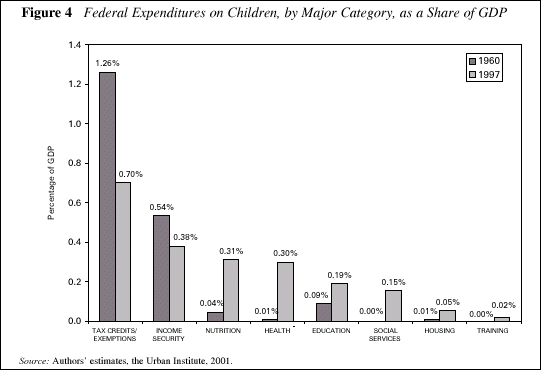
Tax credits and exemptions have been a primary means by which the federal government distributes money to children. While overall federal tax credits and exemptions have increased in real dollar terms (from $31.5 billion in 1960 to $56.1 billion in 1997 in constant 1997 dollars) as a share of total federal expenditures on children, there has been a percentage decline from 65 to 33 percent. As a percentage of GDP, tax credits and exemptions related to children have dropped from 1.26 percent to 0.70 percent.
The next largest program area, income security, was second to tax credits and exemptions for all years except 1975, when it slightly surpassed the tax expenditures. As a share of all federal expenditures on children, income security programs have been declining since the peak year of 1975. They also dropped in real value between 1975 and 1990. In 1960, income security programs accounted for 28 percent of federal expenditures on children; by 1997 they accounted for only 18 percent. Meanwhile, total spending on income security in real dollar terms rose from $13.4 billion to $30.0 billion, but it declined as a share of GDP, from 0.54 percent to 0.38 percent.
While at one time education was the third largest federal area for spending on children, by 1997 it was fifth. Still, federal spending on education was quite small in 1960, so by 1997 it was a significant multiple of its 1960 level, whether viewed by growth in real dollars (from $2.3 billion to $15.1 billion) or in growth in share of GDP (from 0.09 percent to 0.19 percent).
Nutrition and health programs now rank third and fourth among major areas of spending on children—a major increase. Between 1960 and 1997, federal expenditures on nutrition programs rose from 0.04 percent of GDP ($1.1 billion) to 0.31 percent of GDP ($24.9 billion). Expenditures on health rose even more dramatically, from a mere 0.01 percent of GDP ($0.2 billion) to 0.30 percent of GDP ($23.9 billion).
The 1960 federal budget listed no social service expenditures category for children’s programs. By 1997, federal social service expenditures on children accounted for 0.2 percent of GDP ($12.3 billion). By 1997, three programs accounted for most federal social service expenditures on children: Head Start (31 percent), foster care (26 percent), and the child portion of the Social Services Block Grant (12 percent).
The Dependent Exemption and Other Tax Provisions
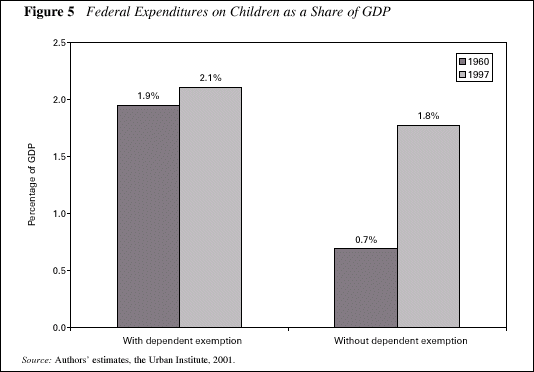
The calculation of total federal support for children is affected significantly by the inclusion of tax items. In 1960, the dependent exemption was the federal government’s major mechanism for targeting money to children, constituting 65 percent of all federal expenditures. Excluding the dependent exemption changes the picture of federal transfers to children in two major ways (figure 5). First, it substantially lowers estimates of federal efforts for children for all periods studied because it is always one of the top two sources of federal transfers for children. Second, because the federal dependent exemption for children declined as a share of total federal support for children (from 65 percent in 1960 to 16 percent in 1997), excluding the exemption increases the rate of growth in federal expenditures on children. If the dependent exemption is included, federal support of children increased by 246 percent; if not, federal effort increased by 726 percent.
Although the nominal value of the dependent exemption increased slightly in the 1960s through early 1980s, the real value of the exemption declined until 1987, when the nominal dependent exemption increased by $820, from $1,080 to $1,900. (The exemption, which reduces the family income that is subject to federal income tax, was indexed for inflation for years after 1984, and the 1987 increase reflects the bulk of the increase enacted as part of the Tax Reform Act of 1986.) Nonetheless, in real terms—much less relative to household income—the dependent exemption still has not recovered its 1960 level. A new child tax credit enacted in 1997 and worth $500 per child in 1999 will change the future tax picture of spending for children.
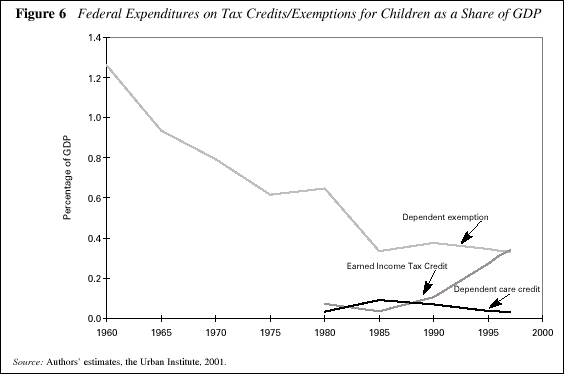
Between 1960 and 1997, federal tax programs aimed at children essentially shifted aim from all children—especially children of taxpayers with enough income to owe income tax—to programs aimed at poor children (figure 8). Although total transfers to children through the federal tax system increased between 1960 and 1997, from $31.5 billion to $56.1 billion, the overall real value of the dependent exemption (despite some fluctuations) declined, from $31.5 billion to $26.6 billion. Most of the increase in transfers through the federal tax system stems from the Earned Income Tax Credit (EITC), a credit enacted in 1975 for low-income working taxpayers with qualifying children. In 1980 the EITC expenditure amounted to $3.7 billion. But by 1997 it was $27.1 billion, surpassing the dependent exemption and making it the largest federal tax program aimed at children. As discussed below, the introduction of the EITC and its growth account for more of the rise in federal expenditures on children than any other program.6
How the EITC is allocated significantly affects the overall calculation of federal expenditures on children. Because about 97 percent of the EITC is available to families only if they have children, this study allocates that percentage of EITC outlays to spending on children. But the EITC could be allocated proportionately within the household so that each individual is credited with an equal share of the EITC benefit. According to the Individual Statistics of Income and the March Current Population Surveys, on average, about half of individuals in EITC units containing children are children. When the EITC is attributed to children and adults proportionately within households, the growth in federal expenditures on children between 1960 and 1997 comes to only $107.1 billion rather than $119.8 billion. Furthermore, if the EITC is allocated to both children and adults within families, federal expenditures on children as a percentage of GDP remains flat, amounting to 1.9 percent of total GDP in both 1960 and 1997 (rather than rising to 2.1 percent).
Sources of Growth in Real Expenditures on Children: Individual Programs
Three programs—all new since 1960—account for half of the increase in total spending on children between 1960 and 1997: the EITC, at 22.1 percent of the total increase; Medicaid expenditures on children, at 18.1 percent; and Food Stamp Program expenditures on children at 10.5 percent.7 No other single program accounts for more than 6 percent of the increase. These three programs are also the three largest in 1997, representing more than a third of total federal expenditures on children.8 While the number of children in the United States increased slightly between 1960 and 1997, from 67.1 million to 73.6 million, this factor by itself would account for less than 4 percent of the increase in federal expenditures on children if real spending per child had been held constant.
AFDC—an often-studied and often-criticized program, that in 1996 was overhauled and replaced with TANF—accounted for very little increase. AFDC or TANF accounted for only 4.1 percent of the increase in federal expenditures on children. In 1997, TANF accounted for only 5 percent of federal expenditures on children, well below its peak of 11.4 percent in 1975. As a percentage of GDP, federal expenditures on AFDC/TANF reached its nadir in 1996 and 1997.
Education
The 1960 to 1997 period witnessed important shifts in the types of children targeted to receive federal education funds. There was a shift toward funding education programs aimed at children disadvantaged by economic hardship or by physical or mental impairment (figure 7). In 1960 the largest single federal education program was Impact Aid, which pays for construction, maintenance, and operation of schools in military bases and school districts with high proportions of children receiving federal aid or service (Office of Management and Budget 1996, p. 385). Because the link was parents’ military and federal employment, this program probably helped children from a wide spectrum of economic backgrounds but only a modest number of seriously disadvantaged children. As a share of all federal education expenditures for children, Impact AID has declined from slightly more than half to about one-twentieth.
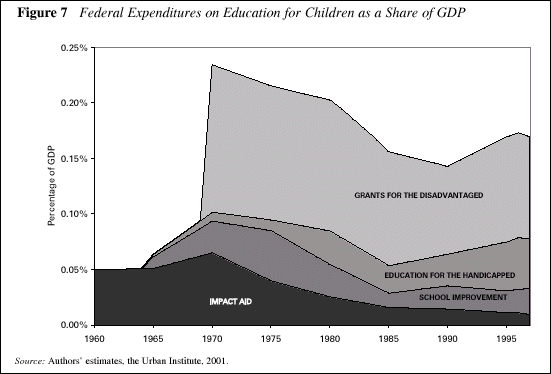
Over these four decades, grants for the disadvantaged, enacted in 1965 through the Elementary and Secondary Education Act, became the predominant program area, accounting for half or more of federal expenditures on educational programs for children since 1970. These grants fund elementary and secondary school programs for children of low-income families, such as children of migratory farm workers and fishers, and institutionalized children and youth. The grants also fund demonstration projects for new approaches to educating disadvantaged children and activities to evaluate Title I programs (Office of Management and Budget 1995c, p. 384).
Spending on Low-Income Children
Most of the growth in federal expenditures on children between 1960 and 1997 reflects expansions in programs for low-income children.9 While the federal government increased its real spending on children by 246 percent during that period, federal expenditures aimed at low-income children rose by more than 2,000 percent, from $5.1 billion to $117.3 billion. Federal expenditures not specifically aimed at low-income children rose by only 23 percent over this period, from $43.5 billion to $53.7 billion. Thus, the share of total federal expenditures dedicated to programs aimed at low-income children rose from 11 percent to 69 percent between 1960 and 1997.
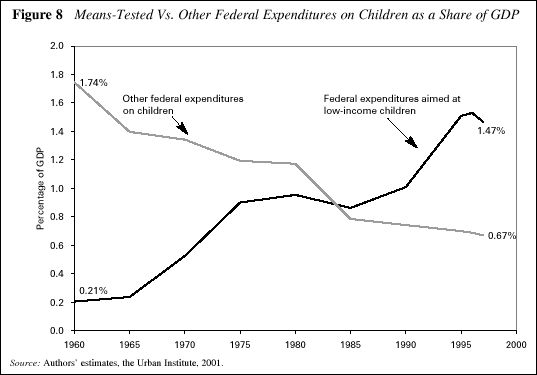
The nearly constant trend in federal expenditures on children as a percentage of GDP—rising from 1.9 percent in 1960 to 2.1 percent in 1997—masks differences between programs aimed at low-income children and general children’s programs. Between 1960 and 1997, the percentage of GDP going to the general programs dropped from 1.74 percent to 0.67 percent, while the percentage of GDP going to federal programs targeting low-income children rose from 0.21 percent to 1.47 percent (figure 8). Essentially, spending on children was converted from broad-based, middle-class relief into welfare-like programs.
This transformation can be contrasted with the much larger federal programs benefiting the elderly. Federal expenditures on the nonchild portion of Social Security and Medicare alone, as a percentage of GDP, rose dramatically between 1960 and 1997, from 2 percent to 7 percent. Those two major federal programs benefiting the elderly are broad-based, reaching nearly all older Americans, low-income or not. Also in contrast to the historical evolution of children’s programs, Social Security gradually replaced such income-tested programs as Old Age Assistance and Supplemental Security Income. In health, the issue is more complicated, because the portion of the means-tested Medicaid program devoted to long-term care has also grown significantly. Nonetheless, most health and cash assistance to the elderly is not means-tested.
Toward the Future
Projecting how these past trends will carry forward to future spending on children is difficult. Spending for children as a percentage of GDP held its own ground between 1960 and 1997, but its share of domestic spending actually went down because there were fairly dramatic increases in the size of that pie.
Over the short term, because of some recent initiatives, federal expenditures on children will increase. The Taxpayer Relief Act of 1997 established a new child tax credit that will cost approximately $21.5 billion in fiscal year 2000.10 And, though states have been slow in taking up another new option, Medicaid eligibility requirements for children have been loosened, so children from better-off families can now receive coverage. Initially, these new programs and program expansions should more than offset declines expected relative to GDP in many other programs. In terms of devolution, the Medicaid expansion does shift more responsibility to states, but the child credit works in the opposite direction.
Over the long term, growth in federal expenditures on children may be inhibited by at least two factors. First, it is unlikely that overall domestic spending will expand as dramatically in the foreseeable future as it has in the past four decades. Past growth was financed largely by converting the defense budget (from 14 percent of GDP post-Korea to about 3 percent today). Reductions in defense spending as a percentage of GDP, however, have tapered off now that defense represents a much smaller share of the GDP and the budget. Second, ever larger shares of domestic spending are scheduled (through automatic growth) to go largely for retirement and health care. Although children may share a bit in the automatic growth anticipated for health care, few programs for children have this type of built-in automatic growth. As a result, many programs benefiting children can be expected to decline as a percentage of GDP unless new legislation increases the amounts involved.
New legislation—expenditure increases or tax cuts—might be likely if budget surpluses continue. Tax changes in 2001, for instance, are likely to initiate an expansion of the child credit. By about 2010, however, other commitments already made will begin to take off as the first baby boomers begin to retire.
It is also not clear how future federal expenditures on children will be targeted. Between 1960 and 1997, there were two general trends that in recent years seem to have ended—whether temporarily or not. First, over most of this period, fewer federal programs left spending on children to their parents’ discretion, through tax credits or exemptions or through such direct cash assistance as Social Security and AFDC, while more provide in-kind goods and such services as food, medical assistance, housing, and education. However, the expansion of the EITC and, more recently, the new child tax credit have increased the spending left to parental discretion. Second, there had also been a shift away from programs benefiting children at most income levels toward programs predominantly for poor children. This trend was reflected in the decline in the real value of the dependent exemption, for which all families with children are eligible, along with the simultaneous introduction and expansion of programs aimed generally at low-income families: the EITC, education programs for the disadvantaged, Medicaid, and Food Stamps. By granting benefits to many middle-class families with children, however, the new child tax credit once again runs counter to this trend.
We have not attempted to assess the relative merits of these different approaches for allocating federal resources to children. Programs with greater parental discretion may meet individual families’ needs more efficiently. On the other hand, greater discretion, if exercised poorly, could result in less money spent on true necessities or on children. Typically, programs targeted at low-income households accord a larger share of spending to low-income families than more universal programs that tend to subsidize middle-income families as well for their costs of raising and educating children. But low-income programs also involve very high tax rates on work and marriage because benefits phase out as work or marriage to an earner raises household income. These difficult trade-offs help explain the historical vacillation between cash and in-kind benefits, and between low-income and more universal programs.
Recent initiatives on child tax credits and Medicaid on the one hand, coupled with the factors limiting great future expansion of federal expenditures on children on the other, make it difficult to forecast future federal spending on children. Expenditures on children in no small part will be affected by the balance that policymakers attain between two sometimes complementary, sometimes opposing, forces: automatic growth in established programs versus new legislation establishing or expanding existing programs. Whatever else, these forces encourage a continual monitoring of trends in this fast-paced arena.
Notes
1. This study covers only expenditures directly benefiting children or where benefits clearly increase because of the presence of children. It counts all money directly spent on children where applicable (e.g., school lunch, dependent exemptions) and pro-rates within the family when spending varies with family size (e.g., Food Stamps) under various formulas. Nonetheless, while different decision rules for allocating dollars within a family produce somewhat different expenditure estimates for a given year, the overall trends are usually not affected.
2. When a program included 19- to 21-year-olds and an age breakdown of participants was available, we eliminated people in this age group from our estimates. For a few programs, no age breakdown was available, so these adjustments could not be made. For programs directed at all age groups, we obtained, at a minimum, a breakout of youth versus adult, and we could usually estimate the proportion of participants age 18 or younger.
3. While this paper was in pre-publication, the Congressional Budget Office (CBO) published its latest report on federal expenditures on children for the year 2000. The 1997 figures in this paper for the major spending programs on children are consistent with CBO’s 2000 figures, but with one major difference. This analysis includes tax expenditures on families with children in addition to pure budgetary outlays. We include in the totals the dependent exemption and the tax reduction portion of the Earned Income Tax Credit (EITC) for qualifying households. Moreover, we provide a historical overview of federal spending on children over the past 40 years, while CBO’s report is only for the current year.
4. The federal budget excludes tax subsidies in its measure of direct expenditures, so we do not divide our total expenditures on children, which include tax subsidies, by the government’s measure of direct expenditures only.
5. These programs serve mostly the elderly, though disabled adults and some others also receive benefits. Between 1960 and 1997, the number of individuals age 65 and older increased by 9.6 percent (from 67,138,000 to 73,554,000), while the nonchild portion of Medicaid, Medicare, and Social Security, in real FY1997 dollars, increased by 1,358.7 percent (from $50.2 billion to $731.9 billion).
6. We treated the EITC as a tax program, but in official budget calculations a large share of it is counted as direct expenditure to the extent it exceeds income tax otherwise due. Only the portion that reduces positive tax liability is treated as a reduction in tax.
7. Starting in 1994, eligibility for a small EITC was expanded to include childless workers.
8. The first fiscal year in which food stamp benefit and eligibility rules were, by law, nationally uniform and indexed for inflation was 1972. Medicaid was authorized in 1966 under Title XIX of the Social Security Act. EITC was first enacted in 1975 to provide a credit to low-income working taxpayers with qualifying children.
9. The programs we counted as aimed primarily at low-income children are as follows: Aid to Families with Dependent Children (AFDC), Child Support Enforcement, Emergency Assistance, Supple-mental Security Income, Food Stamp Program, Child Nutrition, Special Milk, Women, Infants, and Children, Commodity Supplemental Food, Low-Income Home Energy Assistance, Low-Rent Public Housing, Section 8 Low-Income Housing Assistance, Rent Supplement, Rental Housing Assistance, Earned Income Tax Credit, Medicaid, Healthy Start, Social Services Block Grant, Community Services Block Grant, Head Start, Foster Care, Adoption Assistance, Child Care and Development Block Grant, AFDC Child Care, Transitional Child Care, At-Risk Child Care, educationally deprived/economic opportunity, grants for the disadvantaged, Joint Training Partnership Act/Comprehensive Employment and Training Act, Job Corps, Summer Youth Employment, and Job Opportunities and Basic Skills Training Program/Work INcentive Program.
Some programs aimed at low-income children also benefit children who are not in low-income families, while some programs not aimed at low-income may benefit low-income children. In this paper, programs are considered to be aimed primarily at low-income children if they were means-tested or if their program description indicated that they were primarily aimed at poor or low-income children or their families. An example of a program primarily aimed at low-income children that also benefits other children is the Child Support Enforcement program, which primarily benefits children receiving AFDC/TANF, but can also be used to ensure payment of child support to children in more affluent families. Similarly, through Child Nutrition programs, low-income children receive free or reduced-price lunches in public schools, although the program also partially subsidizes school lunches for other children as well. An example of an untargeted program benefiting some low-income children is the federal dependent exemption, which can be used by all families if they have any tax liability in the absence of the exemption.
10. Joint Committee on Taxation. 1997. General Explanation of Tax Legislation Enacted in 1997. Washington, D.C.: Government Printing Office. December 17, p. 9.
References
Clark, Rebecca and Rosalind Berkowitz. 1995. "Federal Expenditures on Children, 1960–1995," unpublished report to the Assistant Secretary of Planning and Evaluation, U.S. Department of Health and Human Services, Washington, DC.
Juffras, Jason and Eugene Steuerle. 1991. Table 11-1, "Estimated Public Expenditures on Children, Fiscal Year 1989," in Beyond Rhetoric: The Final Report of the National Commission on Children. Washington, DC: U.S. Government Printing Office.
Office of Management and Budget. 1996. Budget of the United States Government, Fiscal Year 1997—Appendix. Washington, D.C.: U.S. Government Printing Office.
———. 1995. Historical Tables, Budget of the United States Government, Fiscal Year 1996. Washington, D.C.: U.S. Government Printing Office.
For a complete listing of references and data sources used, see our online version.
Appendix—Allocation Methods
For programs where money is spent only on children—examples are child nutrition, Head Start, and most education programs—all program expenditures were attributed to children.
For programs such as the Commodity Supplemental Food Program (in 1985 and later), Job Corps, and most other training programs for which both children and adults qualify, we prorated program expenditures using the proportion of program participants who are children.
For programs such as Social Security and Supplemental Security Income (SSI) for which individuals (rather than family or household units) are the beneficiary unit, the exact amount of expenditures that the federal government reports went to child beneficiaries was attributed to children.
For other programs in which beneficiary units include both adults and children, but the children’s amount is not totally identifiable as a separate item, several techniques were used to estimate the spending benefiting children.
1. For programs in which eligibility does not depend on the presence of children—an example is Food Stamps—expenditures were allocated to children according to the proportion of recipients who were children.
2. For programs in which family units are eligible only if there are children present, three strategies were used.
a. For programs in which benefit levels depend entirely on the number of children in the unit, all expenditures were attributed to children. The exception is EITC, for which the proportion spent on tax filing units containing children was attributed to children.
b. For programs for which the benefit level depends on both the number of children and the number of adults in the unit—for example, Aid to Families with Dependent Children—expenditures to children were allocated according to the proportion of all recipients who were children.
c. For public assistance programs for which the composition of the program units is unknown—for example, public housing and emergency assistance—the proportion of recipients who were children was assumed to be the same as for AFDC units.
These allocation methods are presented graphically in figure 1A.
(Please refer to the PDF version of this report to view figure 1A).
References and Data Sources
Ambrose, Michael. 1995. Personal and facsimile communication from Michael Ambrose, Child Welfare Specialist, Administration for Children and Families, Children's Bureau, to Marta Pernas, formerly of the Urban Institute.
Artfried, Arthur. 1995. Personal communication from Arthur Artfried, Budget Officer, National Institute of Child Health and Human Development, to Marta Pernas.
Barrick, Nettie. 1995. Personal and facsimile communication from Nettie Barrick, U.S. Department of Health and Human Services, Social Security Administration, Office of the Actuary, to Rosalind Berkowitz. June 20.
Bernhardt, Lisa. 1998. Personal communication from Lisa Bernhardt, U.S. Department of Health and Human Services, Administration for Children and Families, to Joseph Murphy. June 12.
Bernhardt, Lisa. 1995. Personal communication from Lisa Bernhardt, U.S. Department of Health and Human Services, Administration for Children and Families, to Rosalind Berkowitz. June 3.
Boxall, Patrick. 1995. Personal communication from Patrick Boxall, Research Associate I, The Urban Institute, Public Finance and Housing Center, to Rosalind Berkowitz. June 19.
Britt, Al. 1995. Personal communication from Al Britt, U.S. Department of Health and Human Services, Administration for Children and Families, to Rosalind Berkowitz. June 15.
Brooks, Mae. 1995. Personal communication from Mae Brooks, U.S. Department of Health and Human Services, Administration for Children and Families, to Rebecca L. Clark. June 21.
Burke, Vee. 1991. Cash and Noncash Benefits for Persons With Limited Income: Eligibility Rules, Recipient and Expenditure Data, FY 1988–90. Washington, D.C.: Congressional Research Service, Education and Public Welfare Division, Income Maintenance.
Burt, Martha R. and Barbara E. Cohen. 1989. America's Homeless: Numbers, Characteristics, and Programs That Serve Them. Washington, DC: Urban Institute Press.
Casey, Connie. 1992. Characteristics of HUD-Assisted Renters and Their Units in 1989. Washington, D.C.: U.S. Department of Housing and Urban Development, Office of Policy Development and Research.
Children’s Defense Fund. 1992. The Nation's Investment in Children: An Analysis of the President's FY 1993 Budget Proposal. Washington, D.C.: Children’s Defense Fund.
Cohen, Phil. 1995. Personal communication through Carolyn Foley, Program Analyst, from Phil Cohen, Branch Chief, U.S. Department of Agriculture, Food, Consumer, and Nutrition Services, Food Distribution, Commodity Supplemental Food Program, to Rosalind Berkowitz. June 4.
Congressional Research Service. 1993. Medicaid Source Book: Background Data and Analysis. ECCP 103-A. Washington, D.C.: U.S. Government Printing Office.
Day, Jennifer Cheeseman. 1993. Population Projections of the United States, by Age, Sex, Race, and Hispanic Origin: 1993 to 2050. U.S. Bureau of the Census, Current Population Reports, P25-1104. Washington, D.C.: U.S. Government Printing Office.
Dubinsky, Michael. 1995. Personal communication from Michael Dubinsky, Statistician, ACF, to Rosalind Berkowitz.
Easley, Michael W. 1990. "The Status of Community Water Fluoridation in the United States." Public Health Reports 105(4): 348–353.
Economic Report of the President, February 1995. Washington, D.C.: U.S. Government Printing Office.
Ellwood, Deborah A., and Steven D. Gold. 1995. "The Distribution Among States of Federal Spending on Children." Unpublished manuscript, report to The Ford Foundation.
Frost, Jennifer, Susheela Singh, Rachel Benson Gold, and Anne Martin. 1993. State Implementation of the Medicaid Eligibility Expansions for Pregnant Women. New York: Alan Guttmacher Institute.
Genser, Jenny. 1995. Personal communication from Jenny Genser, U.S. Department of Agriculture, Food and Nutrition Service, to Rosalind Berkowitz.
Gold, Rachel Benson, and Asta M. Kenney. 1985. "Paying for Maternity Care." Family Planning Perspectives 17(3): 103–111.
Gold, Steven D., and Deborah Ellwood. 1994. Spending and Revenue for Children’s Programs. Washington, D.C.: The Finance Project.
Gray, Larry. 1995. Personal and facsimile communication from Larry Gray, Social Security Administration, Office of Programmatic Systems, to Rosalind Berkowitz. June 21.
Hancock, Cleo. 1995. Personal communication from Cleo Hancock, U.S. Department of Health and Human Services, to Marta Pernas. June 14.
Hargrove, John. 1995. Personal communication from John Hargrove, Social Science Statistician, Administration for Children and Families, Children's Bureau, to Marta Pernas.
Heiser, Nancy. 1992. Characteristics of Food Stamp Households: Summer 1990. Submitted to the U.S. Department of Agriculture, Food and Nutrition Service, Contract No. 53-3198-0-22. Washington, D.C.: U.S. Department of Agriculture, Food and Nutrition Service, Office of Analysis and Evaluation.
Herrin, Joe. 1995. Personal communication from Joe Herrin, Department of the Interior, Bureau of Indian Affairs, to Rosalind Berkowitz.
Huddleston, Marla. 1995. Personal and facsimile communication from Marla Huddleston, U.S. Railroad Retirement Board, Bureau of the Actuary, Division of Benefit and Employment Analysis, to Marta Pernas and to Rosalind Berkowitz. May 18 and June 7.
Kahn, Arthur. 1995. Tabulations from Social Security Administration, Office of Research and Statistics. June 8.
Kessel, Woody. 1995. Personal communication from Woody Kessel, M.D., Director of the Division of Science Education and Analysis, U.S. Department of Health and Human Services, Maternal and Child Health Bureau.
Kenney, Asta M., Aida Torres, Nancy Dittes, and Jennifer Macias. 1986. "Medicaid Expenditures for Maternity and Newborn Care in America." Family Planning Perspectives 18(3): 103–110.
Ketch, Todd. 1995. Personal communication from Todd Ketch, Governmental Affairs Assistant, National Head Start Association, to Marta Pernas.
Ku, Leighton. 1995. Personal communication from Leighton Ku, Senior Research Associate, The Urban Institute, Health Policy Center, to Rosalind Berkowitz. June 26.
Lieberman, Herbert. 1995. Personal communication from Herbert Lieberman, Economist, Administration for Children and Families, to Rosalind Berkowitz.
Liska, David. 1995. Personal communication from David Liska, Research Associate II, The Urban Institute, Health Policy Center, to Rosalind Berkowitz.
Litow, Leon. 1995. Personal communication from Leon Litow, Administration for Children and Families, Office of Community Services, Division of Energy Assistance, to Rosalind Berkowitz. June 12.
Macro International and the Urban Institute. 1995. Final Report - WIC Dynamics: Volume 1. Submitted to the U.S. Department of Agriculture, Food and Consumer Service, Contract No. 53-3198-0-049. Calverton, MD: Macro International.
Muraskin, Lana, Debra Hollinger, and James Harvey. 1994. National Assessment of Vocational Education, Volume 5, Funding and Administrative Issues. Washington, D.C.: U.S. Department of Education, Office of Education Research and Improvement, Office of Research.
National Association for State Community Services Programs. 1989. Community Services Block Grant Statistical Report: 1987. Washington, D.C.: National Association for State Community Services Programs.
———. 1990. Community Services Block Grant Statistical Report: 1988. Washington, D.C.: National Association for State Community Services Programs.
———. 1991. Community Services Block Grant Statistical Report: 1989. Washington, D.C.: National Association for State Community Services Programs.
———. 1992. Community Services Block Grant Statistical Report: 1990. Washington, D.C.: National Association for State Community Services Programs.
———. 1993. Community Services Block Grant Statistical Report: 1991. Washington, D.C.: National Association for State Community Services Programs.
———. 1994. Community Services Block Grant Statistical Report: 1992. Washington, D.C.: National Association for State Community Services Programs.
National Center for Education Statistics. 1981. Digest of Education Statistics 1981. U.S. Department of Education, Office of Educational Research and Improvement. Washington, D.C.: U.S. Government Printing Office.
———. 1994. Digest of Education Statistics 1994. U.S. Department of Education, Office of Educational Research and Improvement. Washington, D.C.: U.S. Government Printing Office.
———. 1996. Digest of Education Statistics 1996. U.S. Department of Education, Office of Educational Research and Improvement. Washington, D.C.: U.S. Government Printing Office.
National Center for Social Statistics. 1971. Graphic Presentation of Public Assistance and Related Data: Demographic and Program Characteristics and Financial Characteristics of Recipients, 1971. Trend Report, DHEW Publication No. (SRS) 73-03101, NCSS Report A-4 (71). Washington, D.C.: U.S. Department of Health, Education, and Welfare.
National Education Association. 1994. 1993–94 Estimates of School Statistics. Washington, D.C.: National Education Association, Research Division.
Nickles, Bill. 1995. Personal and facsimile communication from Bill Nickles, Deputy Assistant Director of Operations, Centers for Disease Control, National Immunization Program, Office of the Director, to Marta Pernas.
Obermaier, Karen. 1995. Urban Institute calculations of HCFA Form 2082 and Form 64. The Urban Institute, Health Policy Center.
Office of Management and Budget. 1971. Budget of the United States Government, Fiscal Year 1972—Appendix. Washington, D.C.: U.S. Government Printing Office.
———. 1975. Budget of the United States Government, Fiscal Year 1976—Appendix. Washington, D.C.: U.S. Government Printing Office.
———. 1976. Budget of the United States Government, Fiscal Year 1977—Appendix. Washington, D.C.: U.S. Government Printing Office.
———. 1981a. Special Analyses, Budget of the United States Government, Fiscal Year 1982. Washington, D.C.: U.S. Government Printing Office.
———. 1981b. Budget of the United States Government, Fiscal Year 1982—Appendix. Washington, D.C.: U.S. Government Printing Office.
———. 1986a. Special Analyses, Budget of the United States Government, Fiscal Year 1987. Washington, D.C.: U.S. Government Printing Office.
———. 1986b. Budget of the United States Government, Fiscal Year 1987—Appendix. Washington, D.C.: U.S. Government Printing Office.
———. 1991. Budget of the United States Government, Fiscal Year 1992. Washington, D.C.: U.S. Government Printing Office.
———. 1992. Budget of the United States Government, Fiscal Year 1993. Washington, D.C.: U.S. Government Printing Office.
———. 1994a. Analytical Perspectives, Budget of the United States Government, Fiscal Year 1995. Washington, D.C.: U.S. Government Printing Office.
———. 1994b. Budget of the United States Government, Fiscal Year 1995—Appendix. Washington, D.C.: U.S. Government Printing Office.
———. 1995a. Analytical Perspectives, Budget of the United States Government, Fiscal Year 1996. Washington, D.C.: U.S. Government Printing Office.
———. 1995b. Budget of the United States Government, Fiscal Year 1996—Appendix. Washington, D.C.: U.S. Government Printing Office.
———. 1995c. Historical Tables, Budget of the United States Government, Fiscal Year 1996. Washington, D.C.: U.S. Government Printing Office.
———. 1996. Budget of the United States Government, Fiscal Year 1997—Appendix. Washington, D.C.: U.S. Government Printing Office.
———. 1997. Budget of the United States Government, Fiscal Year 1998—Appendix. Washington, D.C.: U.S. Government Printing Office.
———. 1998. Historical Tables, Budget of the United States Government, Fiscal Year 1999. Washington, D.C.: U.S. Government Printing Office.
Palmer, Ray. 1995. Personal and facsimile communication from Ray Palmer, Manpower Development Specialist, U.S. Department of Labor, Employment and Training Administration, Office of Employment and Training Programs, to Marta Pernas.
Peed, Daniel. 1995. Personal and facsimile communication from Daniel Peed, U.S. Department of Labor, Employment Standards Administration, to Rosalind Berkowitz.King. June 21.
Pitts, Joyce. 1995. Personal communication from Joyce Pitts, U.S. Department of Health and Human Services, Office of Child Support Enforcement, to Rosalind Berkowitz King.
Porter, Rosalie Pedalino. 1990. Forked Tongue. New York: Basic Books.
Puterbaugh, Steve. 1995. Personal and facsimile communication from Steve Puterbaugh, Program Management Unit Chief, U.S. Department of Labor, Office of Job Corps, to Marta Pernas.
Rubenstein, Carl. 1995. Personal communication from Carl Rubenstein, U.S. Department of Health and Human Services, Administration for Children and Families, Office of Refugee Resettlement, to Rosalind Berkowitz. July 5.
Sabelhaus, John. 1995. Tabulations using 1991 Public Use Statistics of Income Data File. Washington, D.C.: The Urban Institute.
Spencer, Gregory. 1989. Projections of the Population of the United States, by Age, Sex, and Race: 1988 to 2080. U.S. Bureau of the Census, Current Population Reports, Series P-25, No. 1018. Washington, D.C.: U.S. Government Printing Office.
Steuerle, C. Eugene. 1995. Personal communication from C. Eugene Steuerle, Senior Fellow, The Urban Institute, to Rosalind Berkowitz King. July 24.
Sugarman, Jule M. 1994. Expenditures for Children: Existing Data and Perspectives on Budgeting. Draft paper prepared for The Finance Project/Quality 2000 Roundtable on Financing for Early Care and Education.
Taylor, Charlotte. 1995. Personal communication from Charlotte Taylor, Assistant to the Administrator, U.S. Department of Health and Human Services, Public Health Service, Health Resources and Services Administration, Adolescent Health Branch.
Turner, Paul. 1995. Personal and facsimile communication from Paul Turner, Deputy Director, Centers for Disease Control, National Center for Prevention Services, Division of Oral Health, to Marta Pernas. June 12.
U.S. Bureau of the Census. 1974. Estimates of the Population of the United States, by Age, Sex, and Race: April 1, 1960, to July 1, 1973. Current Population Reports, Series P-25, No. 519. Washington, D.C.: U.S. Government Printing Office.
———. 1978. Estimates of the Population of the United States, by Age, Sex, and Race: 1970 to 1977. Current Population Reports, Series P-25, No. 721. Washington, D.C.: U.S. Government Printing Office.
———. 1988. United States Population Estimates, by Age, Sex, and Race: 1980 to 1987. Current Population Reports, Series P-25, No. 1022. Washington, D.C.: U.S. Government Printing Office.
U.S. Code. 1988. Public Law 85-857, Section 1, September 2, 1958, 72 Statute 1105. Washington, D.C.: U.S. Government Printing Office.
———. 1995. Public Law 103-66, Section 13131, August 10, 1993, 107 Statute 433. Washington, D.C.: U.S. Government Printing Office.
U.S. Department of Agriculture. 1987. Characteristics of Food Stamp Households: Summer 1985. Washington, D.C.: U.S. Department of Agriculture, Food and Nutrition Service, Office of Analysis and Evaluation.
———. 1992. Food Assistance Programs. Washington, D.C.: U.S. Department of Agriculture, Food and Nutrition Service.
U.S. Department of Health, Education, and Welfare, Health Care Financing Administration, Medicaid Bureau. 1978. Data on the Medicaid Program: Eligibility, Services, Expenditures Fiscal Years 1966–78. HCFA 78-24523. Washington, DC: The Institute for Medicaid Management.
U.S. Department of Health and Human Services. 1980. Social Security Bulletin: Annual Statistical Supplement, 1980. SSA 13-11700. Washington, D.C.: Social Security Administration.
———. 1981. Social Security Bulletin: Annual Statistical Supplement, 1981. SSA 13-11700. Washington, D.C.: Social Security Administration.
———. 1986. Social Security Bulletin: Annual Statistical Supplement, 1986. SSA 13-11700. Washington, D.C.: Social Security Administration.
———. 1988. Child Support Enforcement: Thirteenth Annual Report to Congress, Volume II, Fiscal Year 1988 Statistics. Washington, D.C.: U.S. Department of Health and Human Services, Office of Child Support Enforcement.
———. 1989. Health Care Financing Program Statistics: Medicare and Medicaid Data Book, 1988. Baltimore: U.S. Department of Health and Human Services, Health Care Financing Administration, Office of Research and Demonstrations.
———. 1991. Social Security Bulletin: Annual Statistical Supplement, 1991. SSA 13-11700. Washington, D.C.: Social Security Administration.
———. 1993. Child Support Enforcement: Eighteenth Annual Report to Congress, For the Period Ending September 30, 1993. Washington, D.C.: U.S. Department of Health and Human Services, Office of Child Support Enforcement.
———. 1994a. Serving America’s Youth: A Directory of HHS Programs. Washington, D.C.: U.S. Department of Health and Human Services, Office of Assistant Secretary for Planning and Evaluation, Office of Human Services Policy, Division of Children and Youth Policy.
———. 1994b. Social Security Bulletin: Annual Statistical Supplement, 1994. SSA 13-11700. Washington, D.C.: Social Security Administration.
U.S. Department of Housing and Urban Development. 1989. Programs of HUD, 1989–1990. HUD-214-PA(17). Washington, D.C.: U.S. Department of Housing and Urban Development.
———. 1992. Housing payments, outlays (adjusted to exclude operating subsidies). Budget Office internal backup material.
———. 1995. Congressional Justifications for 1996 Estimates. Part 2. Washington, D.C.: U.S. Department of Housing and Urban Development.
U.S. Department of Labor. 1994. OWCP Annual Report to Congress FY 1993. Washington, D.C.: U.S. Department of Labor, Employment Standards Administration, Office of Workers’ Compensation Programs.
U.S. General Accounting Office. 1985. Federal Benefit Programs: A Profile. HRD-86-14. Washington, D.C.: U.S. General Accounting Office.
———. 1986. Railroad Retirement: Size, Nature, and Funding Sources. HRD-86-73FS. Washington, D.C.: U.S. General Accounting Office.
———. 1987. Medicaid: Interstate Variations in Benefits and Expenditures. HRD-87-67BR. Washington, D.C.: U.S. General Accounting Office.
U.S. House of Representatives. 1986. Overview of Entitlement Programs: 1986 Green Book. Committee on Ways and Means. WMCP 103-27. Washington, D.C.: U.S. Government Printing Office.
———. 1991. Overview of Entitlement Programs: 1991 Green Book. Committee on Ways and Means. WMCP 103-27. Washington, D.C.: U.S. Government Printing Office.
———. 1992. Overview of Entitlement Programs: 1992 Green Book. Committee on Ways and Means. WMCP 103-27. Washington, D.C.: U.S. Government Printing Office.
———. 1994. Overview of Entitlement Programs: 1994 Green Book. Committee on Ways and Means. WMCP 103-27. Washington, D.C.: U.S. Government Printing Office.
———. 1996. Overview of Entitlement Programs: 1996 Green Book. Committee on Ways and Means. WMCP 103-27. Washington, D.C.: U.S. Government Printing Office.
U.S. Railroad Retirement Board. 1997. Railroad Retirement Board 1997 Annual Report. Chicago: U.S. Railroad Retirement Board.
Wagner, Sharon. 1995. Personal communication from Sharon Wagner, Administrative Officer, U.S. Department of Justice, Office of Justice Programs, Office of the Administrator, to Marta Pernas.
Wells, Michael. 1995. Personal and facsimile communication from Michael Wells, Demographic Statistician, National Center for Veterans Analysis and Statistics, to Marta Pernas.April 24.
About the Authors
Rebecca L. Clark directed this project when she was a senior research associate at the Urban Institute, where she did research on immigration, particularly on the impact of immigrants on the United States, and on issues related to the well-being of children. She is now at the Demographic and Behavioral Sciences Branch of the National Institute of Child Health and Human Development, where her research portfolio includes immigration, internal migration, population and environment, race and ethnicity, and demographic methods.
Rosalind Berkowitz King is a postdoctoral fellow with the Carolina Population Center at the University of North Carolina at Chapel Hill. Her main fields of interest are family demography, sociology of reproduction, and the effects of physical attributes on social interaction. She is currently studying how body image affects the psychological well-being and risk-taking behavior of teens, using the National Longitudinal Study of Adolescent Health (Add Health).
Christopher Spiro was a research assistant in the Urban Institute at the time of this study and is now attending law school at the University of Virginia. While at the Urban Institute, he worked on studies related to tax, budget, and Social Security reform.
C. Eugene Steuerle is a senior fellow at the Urban Institute and author of the columns, "Economic Perspective," for Tax Notes magazine and "After Tax" for the Financial Times. He has worked under four U.S. presidents on a wide variety of Social Security, budget, tax, health, and other major reforms, including service as the deputy assistant secretary of the Treasury for tax analysis (1987–89) and as the original organizer and economic coordinator of the Treasury’s 1984–86 tax reform effort. He is the author or coauthor of more than 150 books, articles, reports, and testimonies, including the recent Urban Institute Press books Vouchers and the Provision of Public Services, The Government We Deserve, Nonprofits and Government: Collaboration and Conflict, and Retooling Social Security for the Twenty-First Century.
Research for this study was undertaken in part under a project for the Assistant Secretary for Planning and Evaluation, U.S. Department of Health and Human Services. Earlier preliminary research had also been provided to the National Commission on Children. Partial funding was also provided through the Urban Institute's Assessing the New Federalism project, a multiyear project to monitor and assess the devolution of social programs from the federal to the state and local levels. That project has received funding from The Annie E. Casey Foundation, the W.K. Kellogg Foundation, The Robert Wood Johnson Foundation, The Henry J. Kaiser Family Foundation, The Ford Foundation, The David and Lucile Packard Foundation, The John D. and Catherine T. MacArthur Foundation, the Charles Stewart Mott Foundation, The McKnight Foundation, The Commonwealth Fund, the Stuart Foundation, the Weingart Foundation, The Fund for New Jersey, The Lynde and Harry Bradley Foundation, the Joyce Foundation, and The Rockefeller Foundation.
The authors thank Marta Pernas and Joseph Murphy for their assistance on this project.

 PDF
PDF